Configuring Statistics
The Statistics module in ABCD is a powerful reporting engine that allows you to extract, cross-reference, and visualize data from your bibliographic databases.
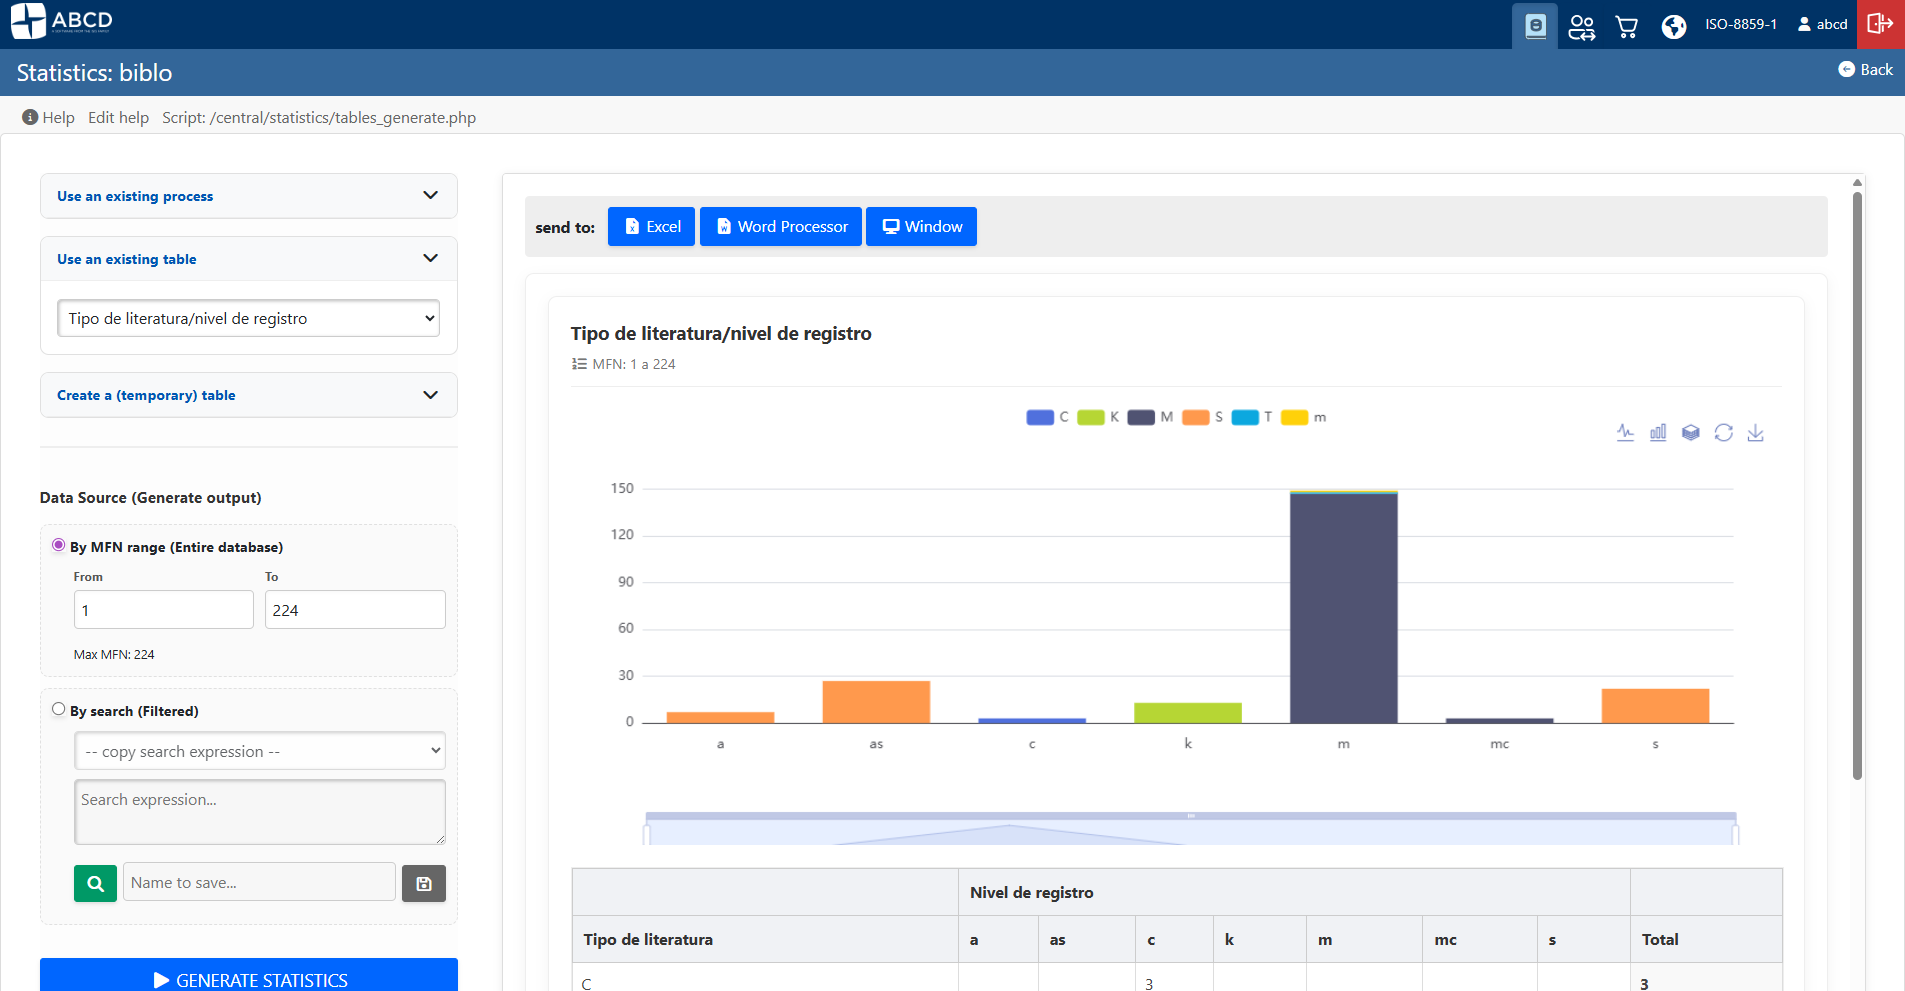
Because library data can be highly complex, generating a chart requires teaching the system how to organize this data. This is done in three sequential stages: defining Variables, building Tables, and grouping them into Processes.
Access: Statistics > Configuration (using the gear icon at the bottom of the Statistics Dashboard).
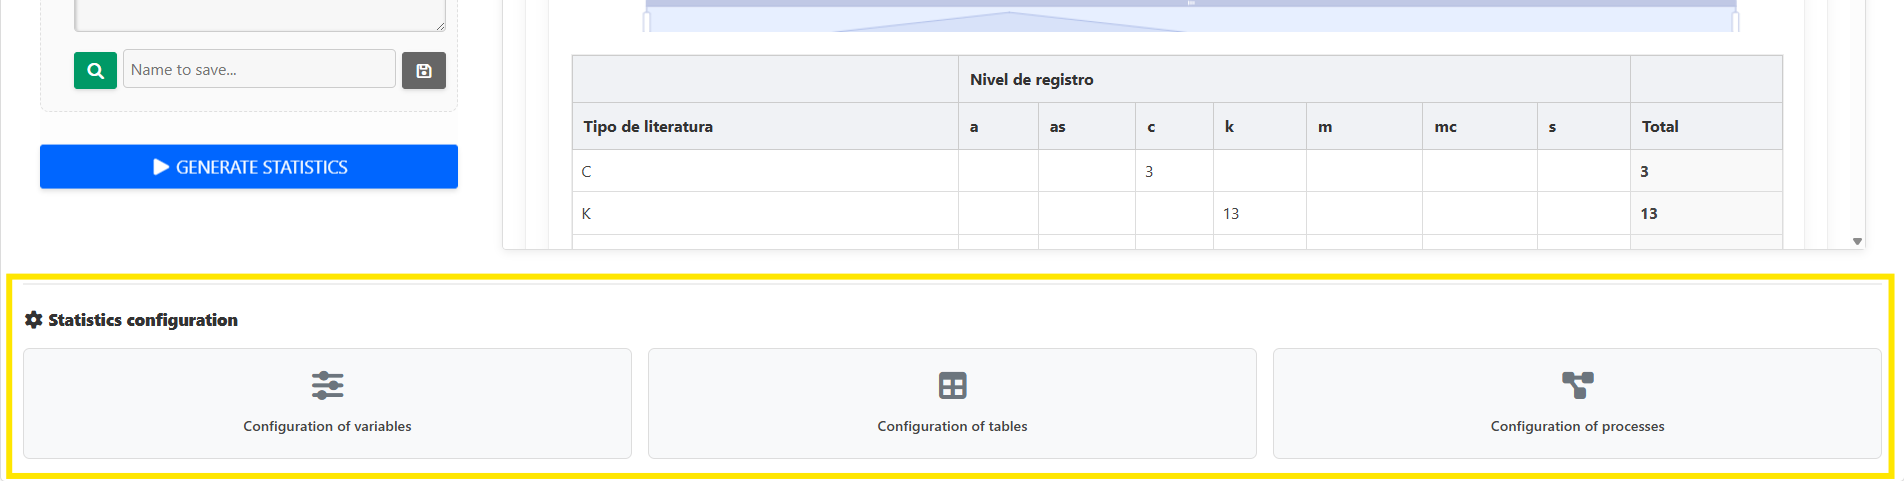
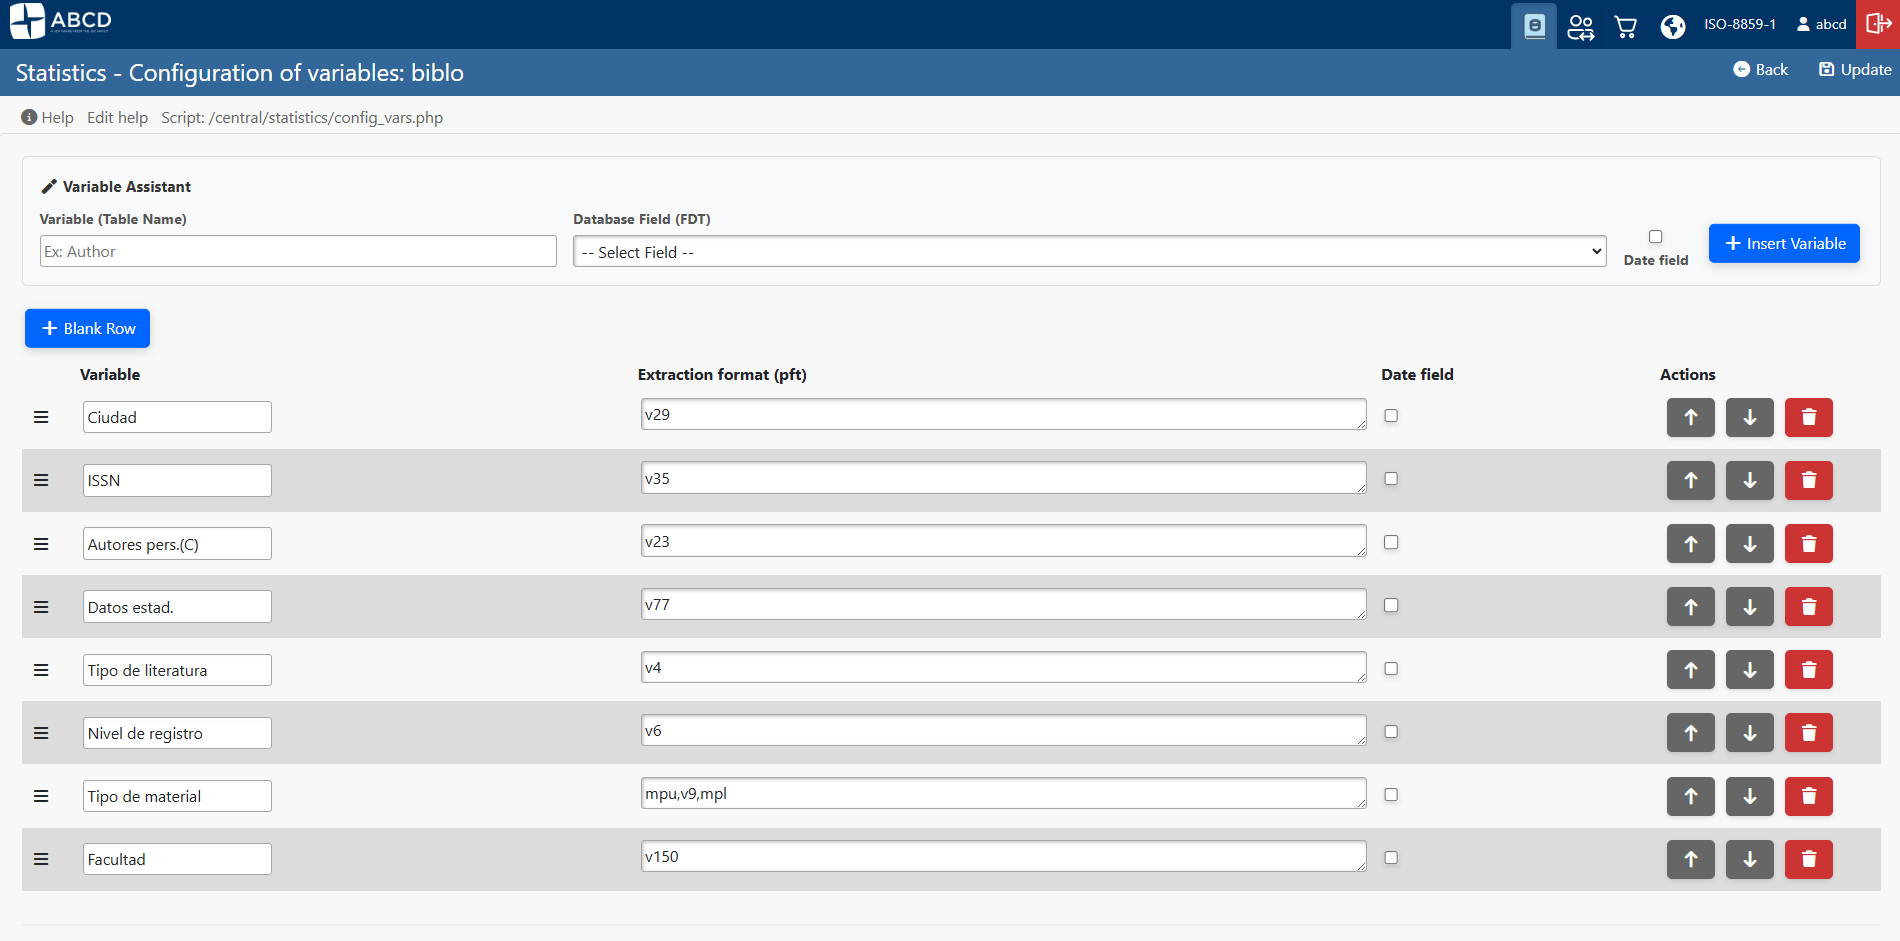
1. Defining Variables (config_vars.php)
A "Variable" is a specific piece of data extracted from a record (e.g., Author, Publication Year, Item Type). Variables are the building blocks of your reports.
- Click on Variables Configuration.
- To create a new variable, you can use the Variable Assistant (Magic Wand):
- Variable Name: Provide a clear, human-readable label (e.g.,
Publication Year). - Database Field: Select the field from the dropdown list (automatically populated from your database's FDT).
- Click Insert Variable and then save.
- Variable Name: Provide a clear, human-readable label (e.g.,
Advanced Configuration: Instead of the assistant, administrators can manually add a "Blank Row" to define a variable using the ISIS Formatting Language (PFT).
- Example:
v10^a(Extracts subfield 'a' of tag 10). - Example:
(v650/)(Extracts all repeatable subjects on separate lines).
Administrator Note Variables are reusable. Once you define "Location", you can use it as a Row or a Column in dozens of different tables without having to recreate it.
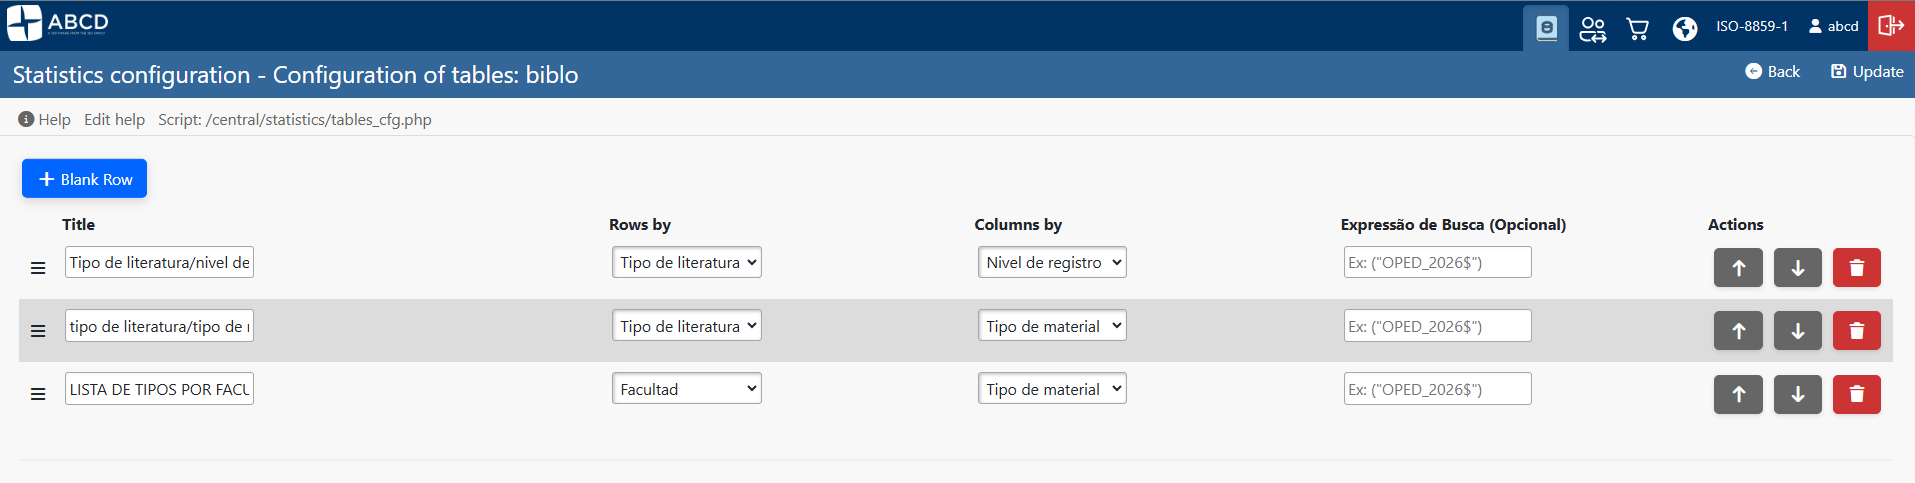
2. Defining Tables (tables_cfg.php)
A "Table" defines the layout of a single report by crossing two variables (Rows × Columns).
- Click on Tables Configuration.
- Click Add Table to create a new row in the configuration matrix.
- Fill in the parameters:
- Title: The report header (e.g.,
Items by Location and Year). - Rows By: Select a variable for the Y-axis (e.g.,
Location). - Cols By: Select a variable for the X-axis (e.g.,
Publication Year). Note: You can leave the Column variable empty to generate a simple Frequency List (Top list). - Search Expression (Optional): This is a powerful filtering tool. You can input an ISIS search expression (e.g.,
("OPED_2026$")) to force this specific table to only process records matching this query.
- Title: The report header (e.g.,
Technical Insight: Table-Level Filtering If you set a Search Expression here, the system will apply it exclusively to this table. This allows you to create comparative reports in a single dashboard (e.g., Table A shows "Records Created in 2026" while Table B shows "Records Edited in 2026"), even when they are generated simultaneously.
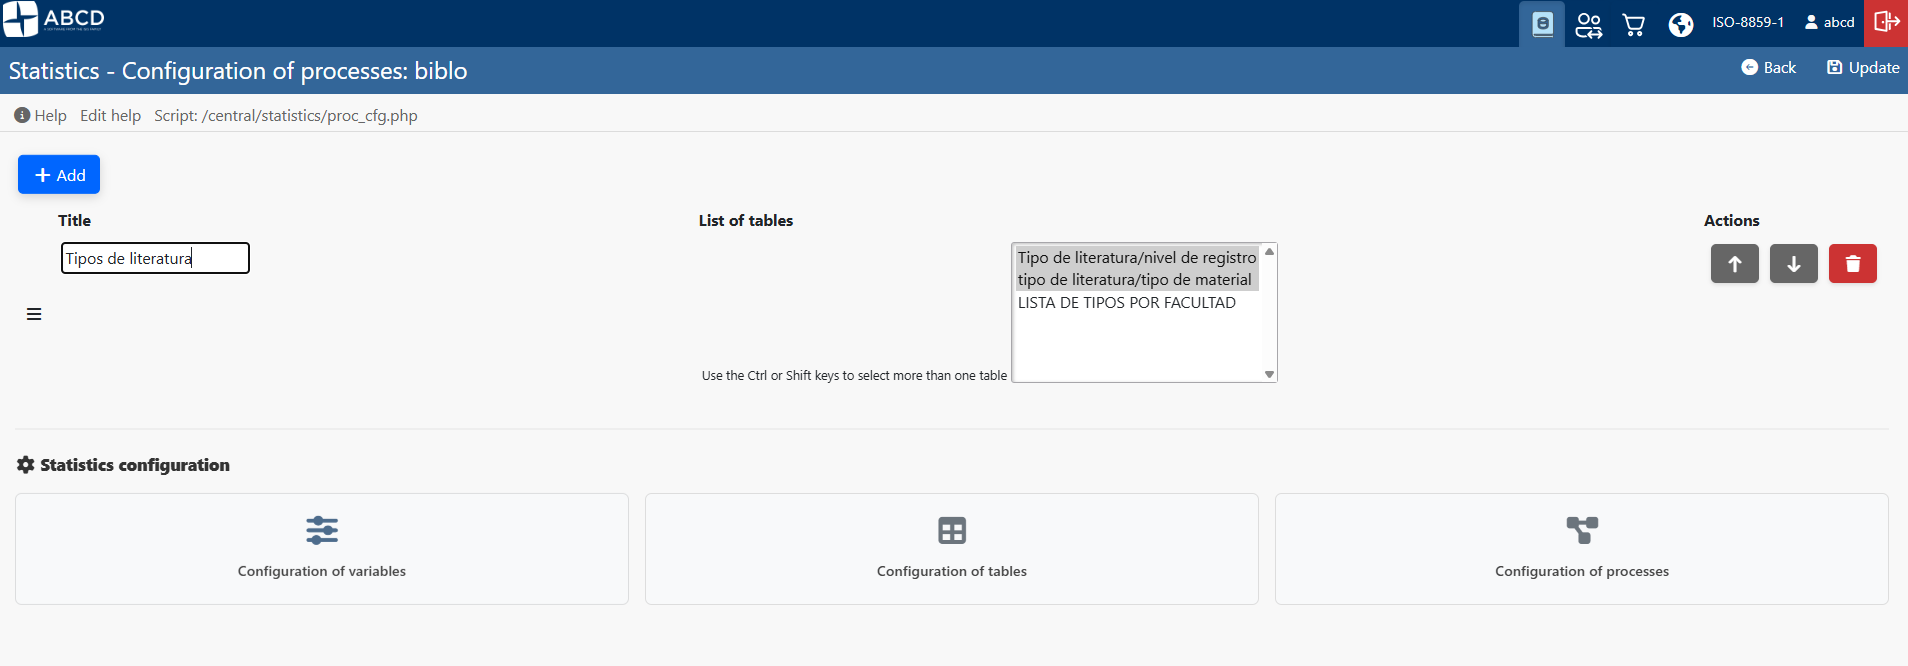
3. Defining Processes (proc_cfg.php)
A "Process" is a collection of tables grouped together. Instead of making the operator generate ten different tables one by one, you can group them into a single "Monthly Report" process.
- Click on Processes Configuration.
- Click Add Process.
- Title: Name the routine (e.g.,
Team Production Dashboard). - Table List: Hold
Ctrl(orCmdon Mac) and click to select multiple tables from the list of previously created tables. - Save the configuration.
Technical Insight: The Multi-Loop Engine In ABCD version 3.7.0+, the statistics module uses a "Multi-Loop Orchestrator". This means that when a Process is executed, the backend engine isolates each table and processes its specific PFT and specific Search Expression independently. This guarantees high-speed performance and zero data conflict between tables.
4. Generating the Output (The Dashboard)
Once your Variables, Tables, and Processes are configured, operators can easily generate beautiful visual reports.
- Go to the main Statistics menu.
- Select your desired output from the accordion menu:
- 1. Use an existing process (Generates multiple tables at once).
- 2. Use an existing table (Generates a single predefined table).
- Choose the Data Source:
- By MFN range: Processes the entire database (or a specific slice of IDs).
- By search (Filtered): Allows the operator to type a global search expression (e.g.,
AU=Smith$).
- Click GENERATE STATISTICS.
Transparency Feature: The generated charts will display a subtitle indicating exactly which filters (MFN or Search Expressions) were applied to generate that specific graph, ensuring complete data governance and clarity for decision-makers.